Peter Lynch Fair Value (PEG / PEGY & Net Cash) Calculator
Based on legendary Fidelity Magellan manager Peter Lynch’s rule that fair P/E equals annual earnings growth rate (PEG = 1.0), adjusted for dividend yield and net cash per share.
Find inputs with free data (Finviz)
Find the values below on the Finviz quote page and enter them in the calculator.
| Calculator input | Where on Finviz |
|---|---|
| EPS | Snapshot > EPS (ttm) |
| Growth g | Snapshot > EPS next 5Y |
| Dividend yield | Snapshot > Dividend TTM (percentage) |
| Net cash/share | (Cash & STI − total debt) ÷ shares, or Cash/sh − Debt/Eq × Book/sh |
| Current price | Snapshot table > Price |
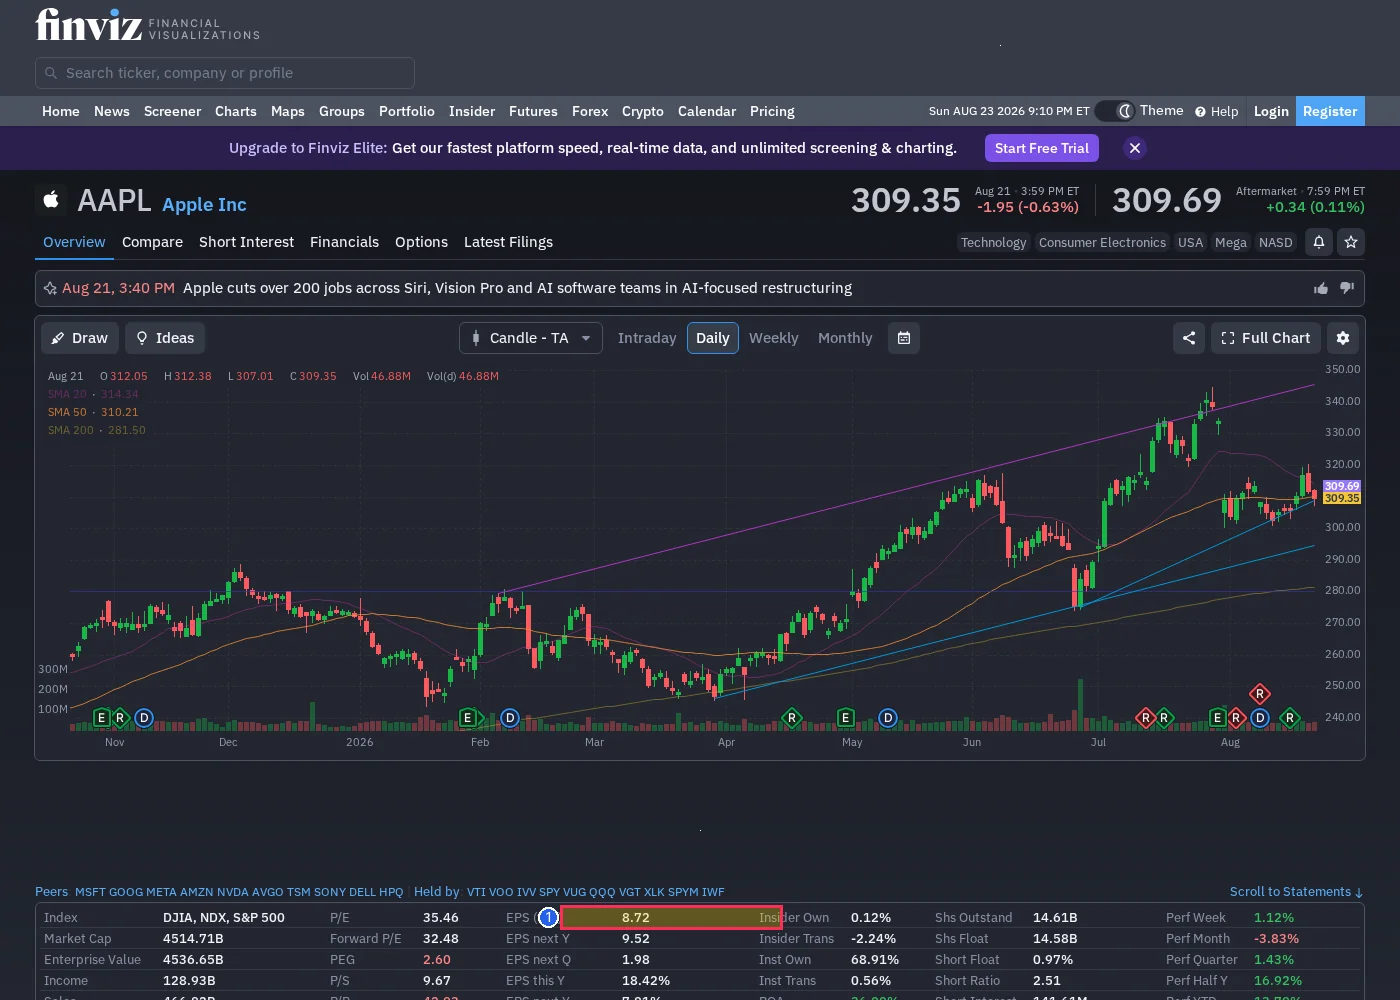
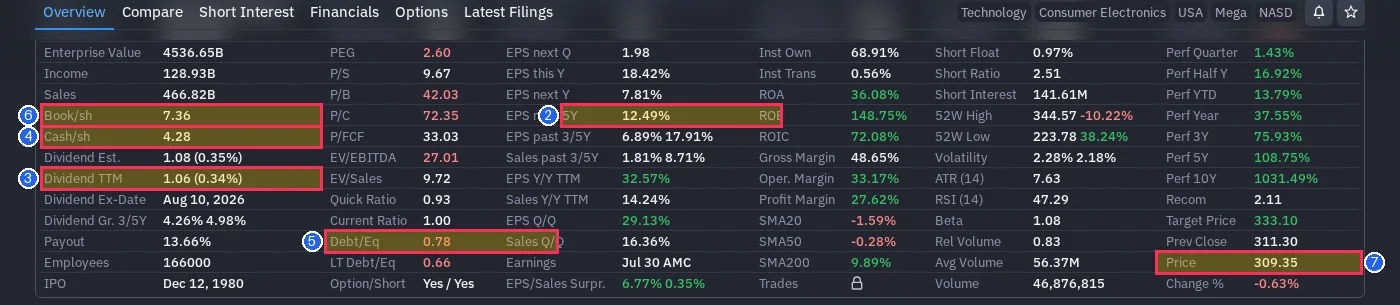
Financial statement figures are under the Income Statement / Balance Sheet / Cash Flow tabs above the snapshot table; set Timeframe to Annual. Click an image to enlarge.
Theoretical Foundation & Equation
Peter Lynch argued that a stock growing at 15% per year deserves a P/E of 15. Factoring in dividend yield creates the PEGY multiple. Adding balance sheet net cash per share provides a complete, grounded intrinsic valuation.
| Symbol | Variable Name | Description | Filing Source Guide |
|---|---|---|---|
| EPS | Earnings Per Share | Normalized TTM Diluted EPS | 10-K / 10-Q Income Statement |
| g | Expected Annual Growth Rate | Expected 3-5 year annual EPS growth rate (Lynch capped at 25%) | Historical earnings trend and conservative forward estimates |
| Dividend Yield | Dividend Yield | Annual dividend divided by stock price (%) | Cash dividend yield |
| Net Cash | Net Cash Per Share | (Cash & Equivalents - Total Debt) / Shares (deduct if net debt) | Balance sheet cash minus total debt |
Step-by-Step Worked Example
Clean balance sheet mid-cap compounder.
Peter Lynch fair value is $56.00 per share ($51.00 operating + $5.00 net cash).
Suitability Checklist & Limitations
- •Growth companies and compounders growing earnings at 10-25% annually with clean balance sheets
- •Profitable mid-cap and large-cap leaders
- •Unprofitable firms, deeply cyclical companies with volatile swings, or declining legacy businesses
- •Fad stocks with unsustainable earnings growth above 30%
Frequently Asked Questions
One Up On Wall Street: How to Use What You Already Know to Make Money in the Market (1989)
View Source / Filing Reference- Always verify that reported net cash is not trapped in foreign subsidiaries or earmarked for immediate debt maturities.