DDM (Dividend Discount Model - Gordon & H-Model) Calculator
DDM values common stock based on the present value of all expected future cash dividends, making it the industry standard for dividend-paying blue chips and financial institutions.
Find inputs with free data (Finviz)
Find the values below on the Finviz quote page and enter them in the calculator.
| Calculator input | Where on Finviz |
|---|---|
| DPS (D0) | Snapshot > Dividend TTM |
| Cost of equity ke | Your assumption (e.g., 8.5%) |
| Growth g | Snapshot > Dividend Gr. 3/5Y |
| Current price | Snapshot table > Price |
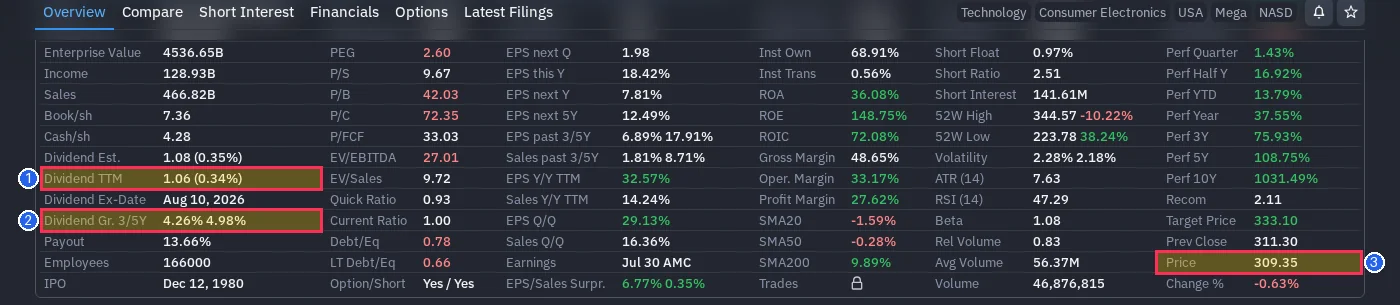
Financial statement figures are under the Income Statement / Balance Sheet / Cash Flow tabs above the snapshot table; set Timeframe to Annual. Click an image to enlarge.
Theoretical Foundation & Equation
The Gordon Growth Model assumes constant perpetual dividend growth (g). The Fuller-Hsia H-Model provides higher realism by modeling an initial high growth rate (gS) that linearly transitions to long-term growth (gL) over a half-life period (H).
| Symbol | Variable Name | Description | Filing Source Guide |
|---|---|---|---|
| D_0 | Current Dividend Per Share | Trailing Twelve Months cash dividend per share | Cash Flow Statement: Dividends Paid / Shares |
| k_e | Cost of Equity | Required rate of return for equity holders (must strictly exceed growth rate) | CAPM or long-term hurdle rate (8-10%) |
| g / g_L | Sustainable Long-Term Growth | Perpetual stable dividend growth rate aligned with GDP growth (2-4%) | Long-term economic outlook |
| g_S / H | Initial Growth & Half-Life (H-Model) | Initial short-term growth rate (gS) and half of total transition duration (H years) | Medium-term corporate payout expansion plan |
Step-by-Step Worked Example
Stable financial holding company with expanding shareholder distributions.
Gordon perpetual growth implies $41.60 fair value, while H-Model incorporating near-term dividend expansion yields $53.60.
Suitability Checklist & Limitations
- •Commercial banks, insurance carriers, financial holding companies, REITs, and regulated utilities
- •Dividend Aristocrats with decades of consistent payout records
- •Non-dividend paying tech stocks or early-stage growth companies reinvesting 100% of profits
- •Aggressive high-yielders paying out dividends in excess of earnings (dividend-cut risk)
Frequently Asked Questions
Dividends, Earnings, and Stock Prices (1959) / A Simplified Common Stock Valuation Model (1984, CFA Institute)
View Source / Filing Reference- Avoid using non-recurring special dividends as base D0.