EPV (Earnings Power Value) Calculator
Developed by Columbia Business School Professor Bruce Greenwald, EPV strips away all speculative growth assumptions (growth = 0%) to value a firm purely on its sustainable operating earnings power capitalized at the cost of capital.
Find inputs with free data (Finviz)
Find the values below on the Finviz quote page and enter them in the calculator.
| Calculator input | Where on Finviz |
|---|---|
| Normalized EBIT | Income Statement > Operating Income |
| Effective tax rate | Income Taxes ÷ Net Income Before Taxes |
| D&A | Cash Flow > Depreciation |
| Maintenance CapEx | Cash Flow > Capital Expenditures (absolute) |
| Non-op cash/investments | Cash & STI + Total Investments |
| Total debt | ST Debt + LT Debt |
| Shares outstanding | Income Statement > Shares Outstanding |
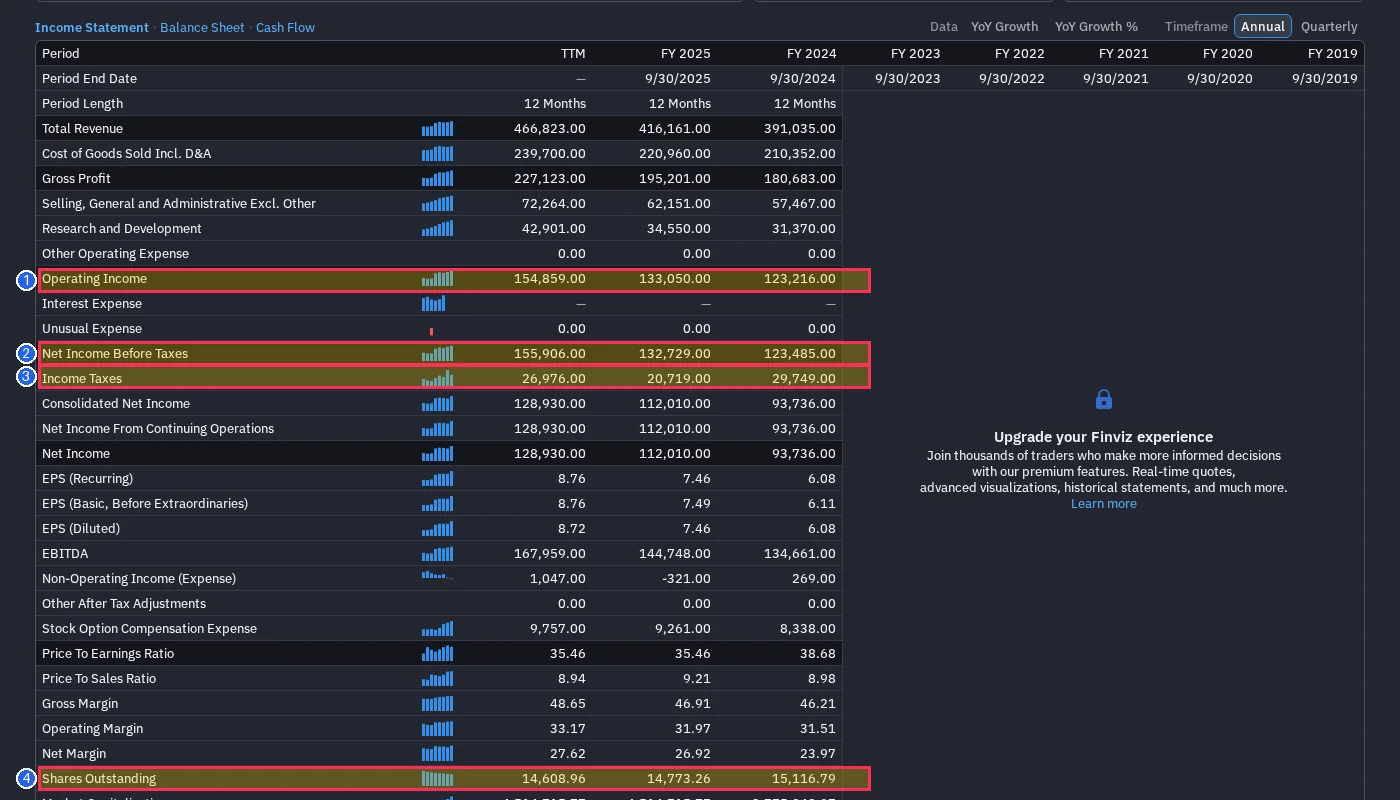
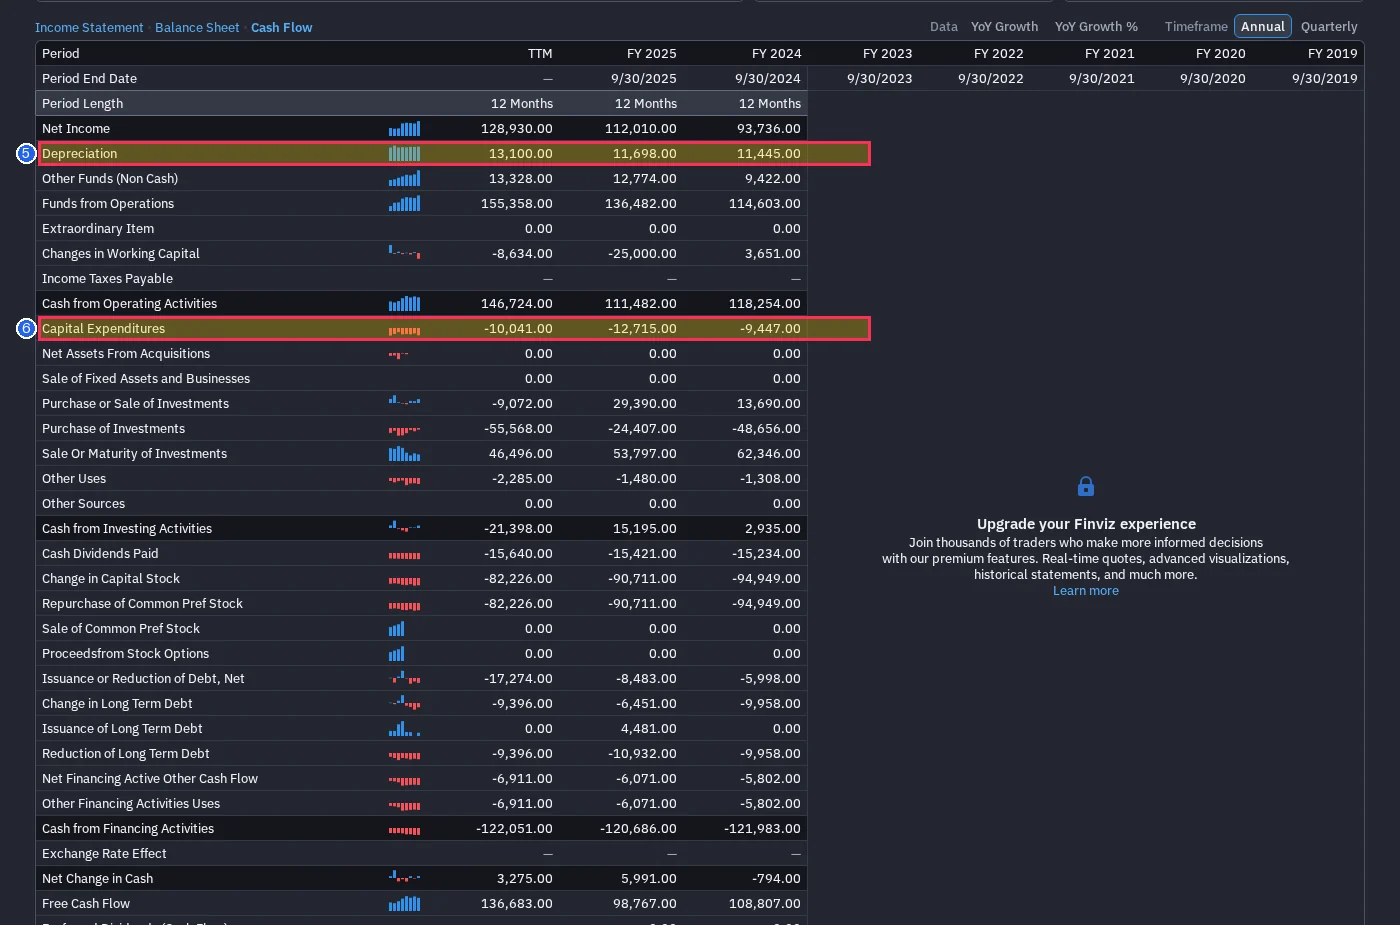
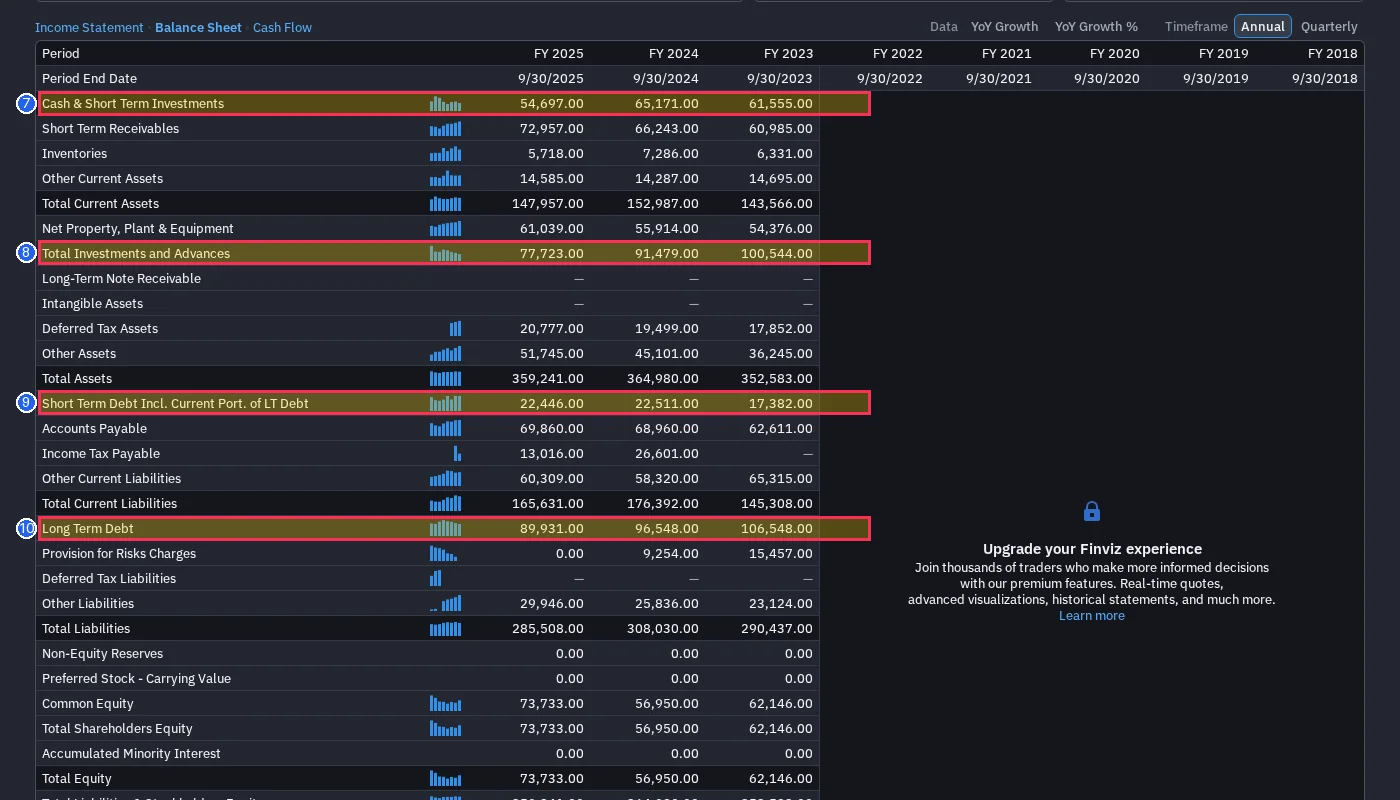
Financial statement figures are under the Income Statement / Balance Sheet / Cash Flow tabs above the snapshot table; set Timeframe to Annual. Click an image to enlarge.
Theoretical Foundation & Equation
EPV normalizes operating earnings (EBIT), deducts taxes and maintenance CapEx, and capitalizes this sustainable NOPAT at the cost of capital (WACC). Cash is added and debt is deducted to isolate equity value.
| Symbol | Variable Name | Description | Filing Source Guide |
|---|---|---|---|
| Normalized EBIT | Normalized EBIT | Sustainable operating earnings stripped of non-recurring items | 10-K Income Statement: Normalized Operating Income |
| Tax Rate | Effective Tax Rate | Normalized corporate tax rate (20-25%) | Historical average effective tax rate |
| Maintenance CapEx | Maintenance CapEx | Capital expenditures required strictly to maintain existing capacity (excluding growth CapEx) | Cash Flow Statement: Estimated replacement CapEx |
| k | Cost of Capital | Required hurdle rate or WACC (8-10%) | Weighted Average Cost of Capital |
Step-by-Step Worked Example
Greenwald no-growth benchmark valuation case.
Under strict zero-growth assumptions, intrinsic Earnings Power Value is $73.00 per share.
Suitability Checklist & Limitations
- •Mature cash cow businesses with protected competitive moats
- •Value investors refusing to pay for speculative future growth
- •Unprofitable startups and rapid-growth software firms yet to turn a profit
- •Secularly declining legacy businesses losing operating profit to technological disruption
Frequently Asked Questions
Value Investing: From Graham to Buffett and Beyond (Wiley Finance, 2001)
View Source / Filing Reference- Ensure that maintenance CapEx accurately reflects true replacement depreciation costs.