Relative Multiples (P/E, P/B, EV/EBITDA, P/S) Calculator
Computes market-implied fair equity value by applying peer group valuation multiples (P/E, P/B, EV/EBITDA, P/S) to company financial metrics.
Find inputs with free data (Finviz)
Find the values below on the Finviz quote page and enter them in the calculator.
| Calculator input | Where on Finviz |
|---|---|
| Target EPS | Snapshot > EPS (ttm) |
| Target BVPS | Snapshot > Book/sh |
| SPS | Income Statement > Total Revenue ÷ Shares |
| Peer multiples | Finviz Screener/Groups industry averages |
| Current price | Snapshot table > Price |
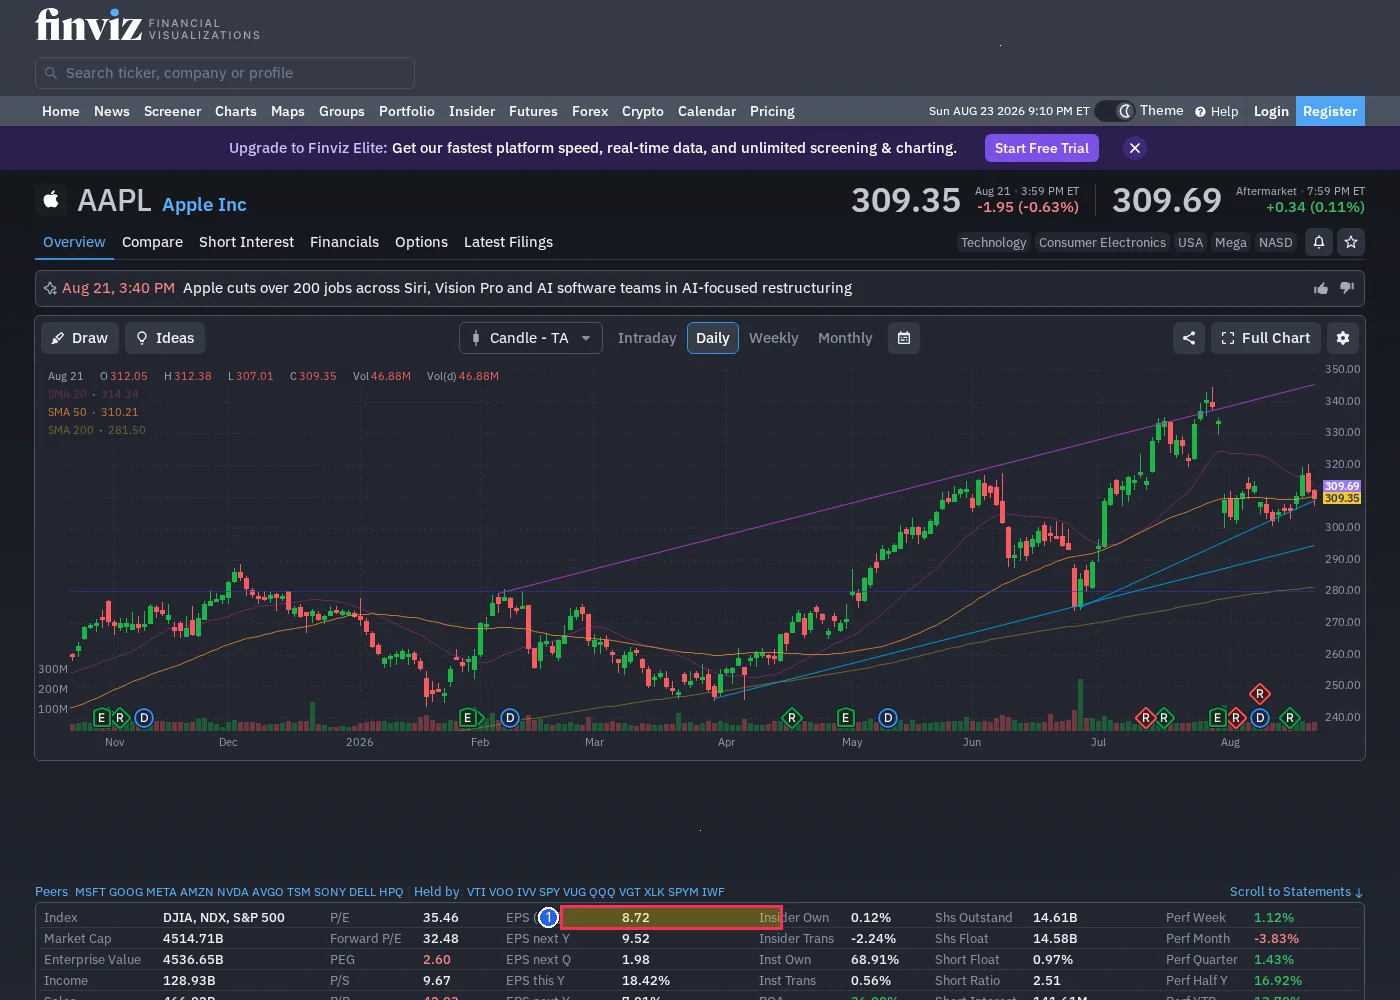
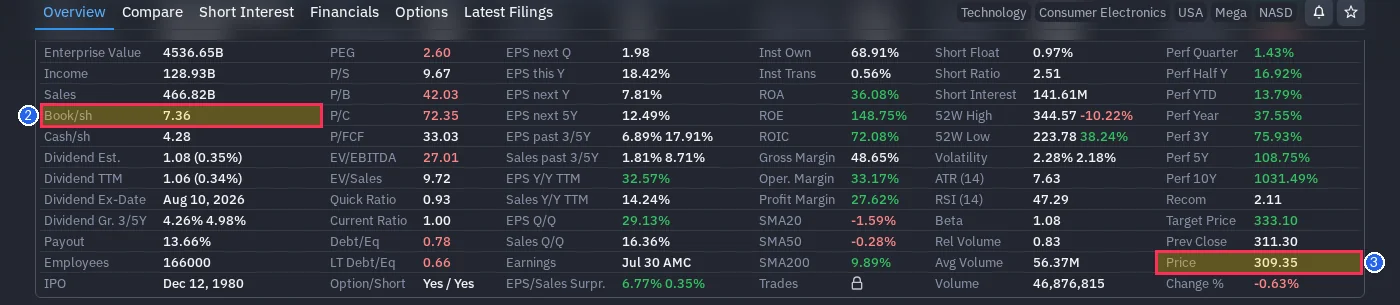
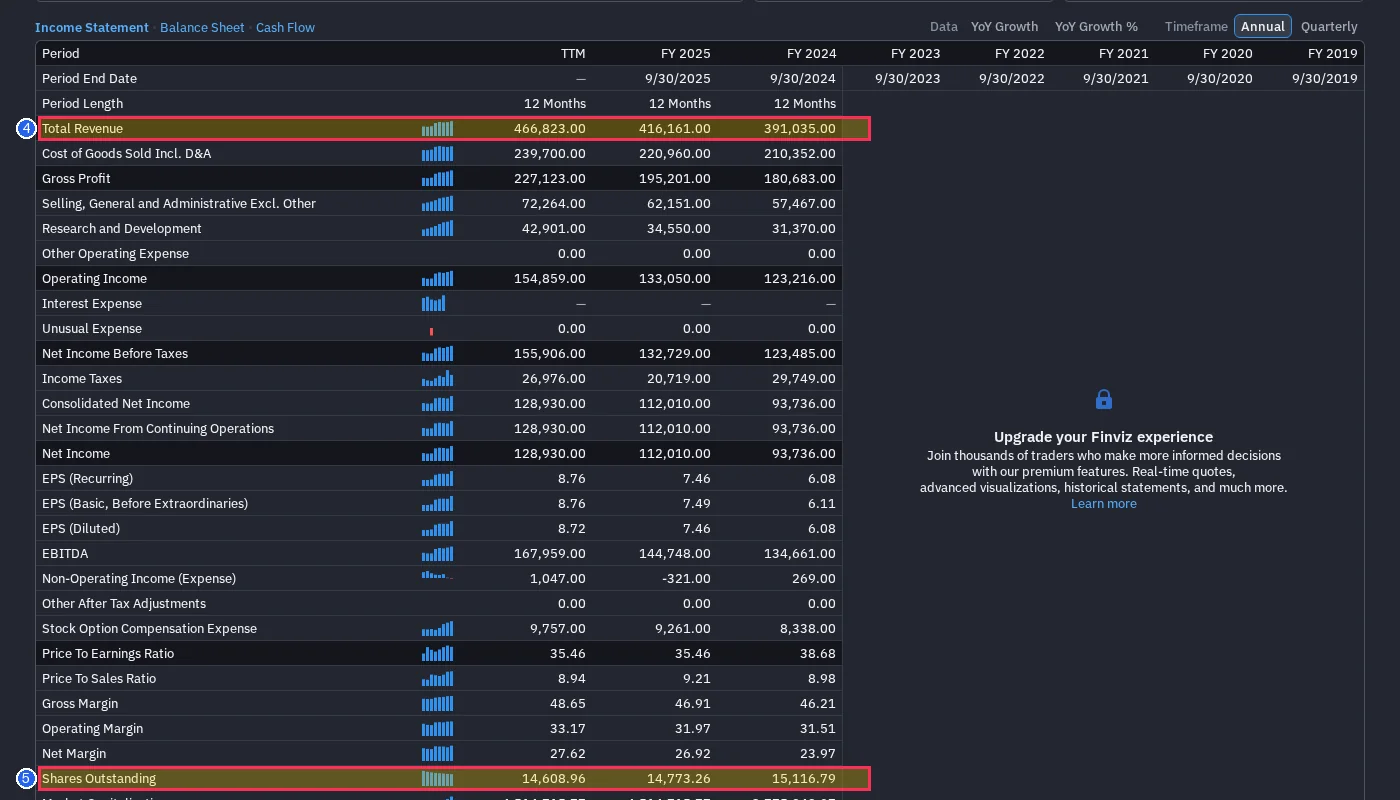
Financial statement figures are under the Income Statement / Balance Sheet / Cash Flow tabs above the snapshot table; set Timeframe to Annual. Click an image to enlarge.
Theoretical Foundation & Equation
Relative valuation determines the value of an asset by looking at how the market prices similar assets. Multiples are standardized financial ratios that allow quick peer-group benchmarking.
| Symbol | Variable Name | Description | Filing Source Guide |
|---|---|---|---|
| P/E | Price-to-Earnings | Stock price divided by earnings per share | Peer group median P/E multiple |
| P/B | Price-to-Book | Stock price divided by book value per share | Peer group median P/B multiple |
| EV/EBITDA | Enterprise Value to EBITDA | Capital-structure neutral operating cash multiple | Peer group median EV/EBITDA |
| P/S | Price-to-Sales | Stock price divided by revenue per share | Peer group median P/S multiple |
Step-by-Step Worked Example
Standard relative benchmarking against industry peers.
P/E multiple implies $60.00 fair price with a ±15% range of $51.00 - $69.00.
Suitability Checklist & Limitations
- •Companies operating in mature industries with abundant listed comparables
- •Rapid sanity check against market trading conditions
- •Unique monopoly businesses with zero direct peers
- •During widespread market bubbles or deep market dislocations
Frequently Asked Questions
Equity Valuation Using Multiples (Journal of Accounting Research, 2002)
View Source / Filing Reference- Always use median peer multiples rather than simple averages to minimize distortion from outliers.