S-RIM (Residual Income Model) Calculator
S-RIM computes intrinsic equity value by adding the discounted present value of future excess returns (ROE exceeding cost of equity) to the current book value of equity.
Find inputs with free data (Finviz)
Find the values below on the Finviz quote page and enter them in the calculator.
| Calculator input | Where on Finviz |
|---|---|
| Total equity | Balance Sheet > Total Equity ($M) |
| Expected ROE | Snapshot > ROE (adjust down for heavy buybacks) |
| Required return | Your assumption (e.g., 9%) |
| Shares outstanding | Income Statement > Shares Outstanding |
| Current price | Snapshot table > Price |
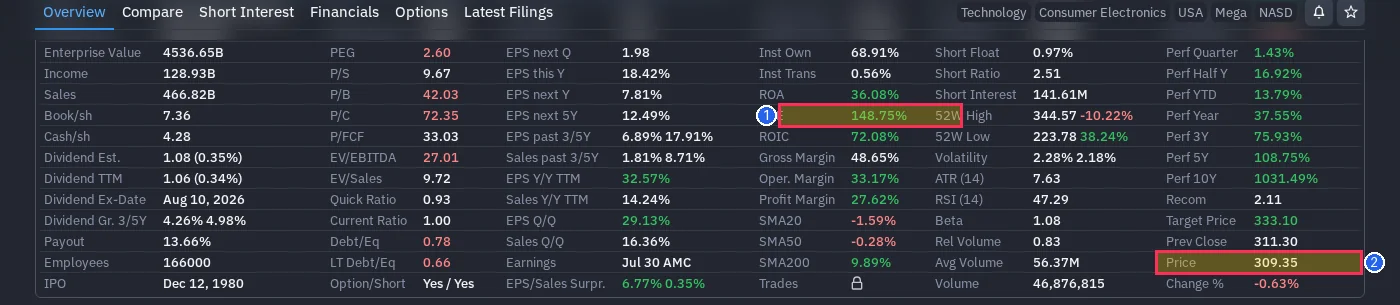
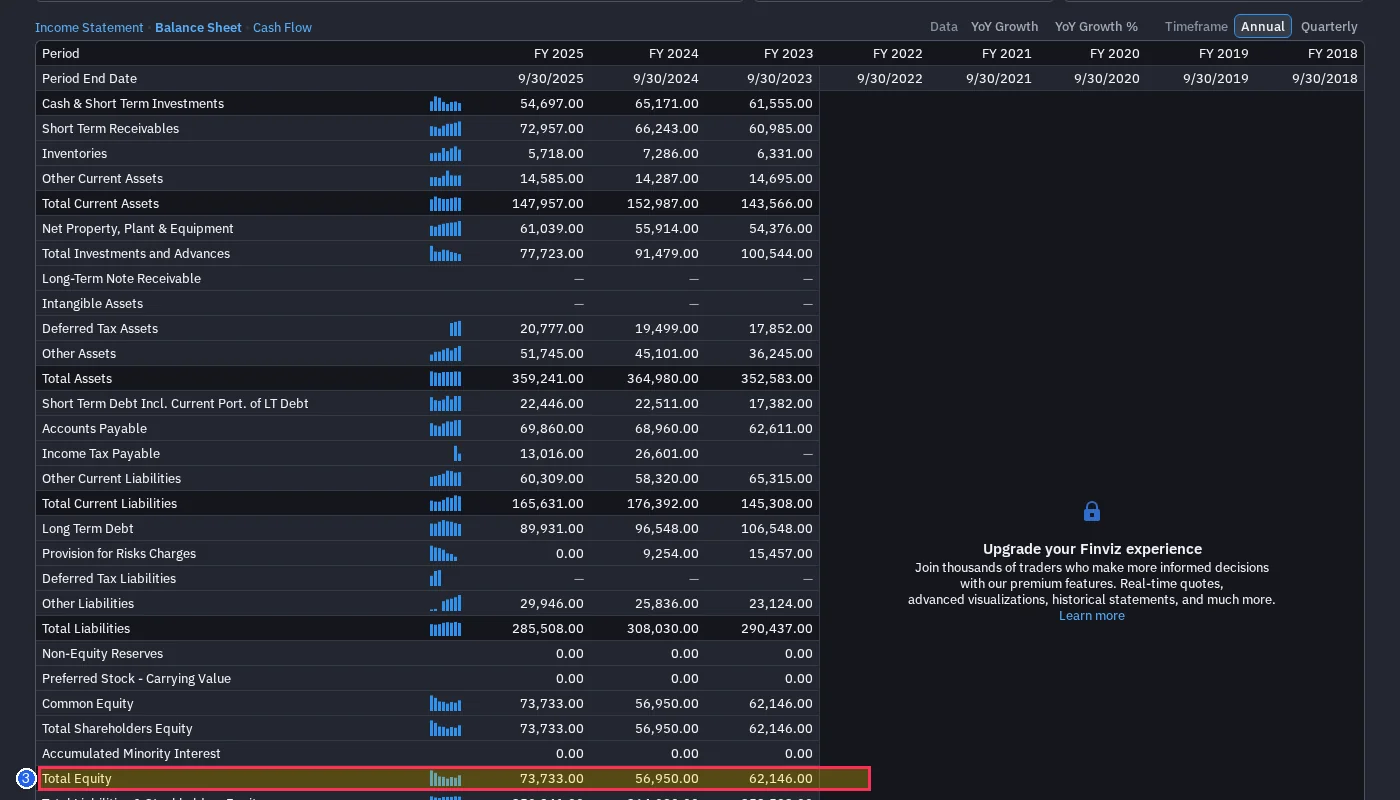
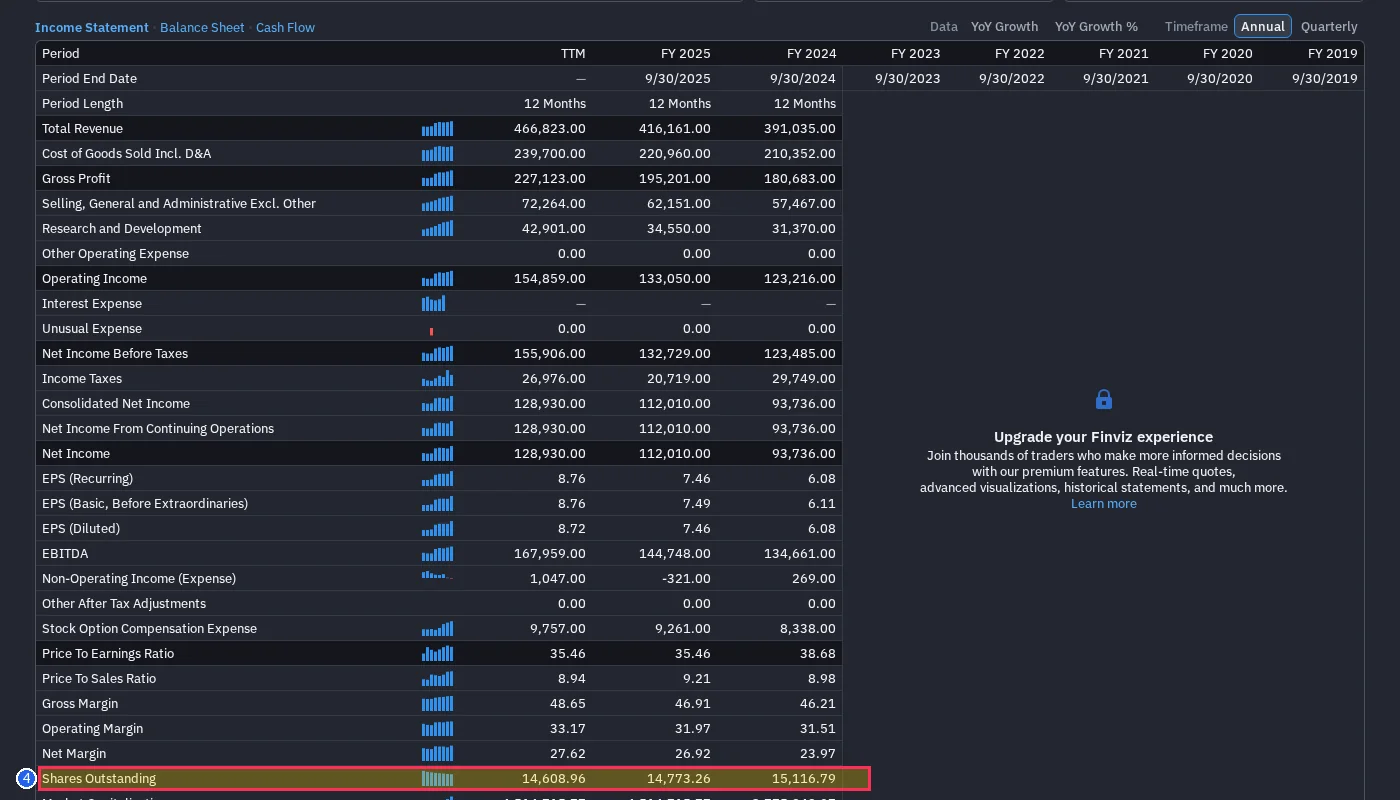
Financial statement figures are under the Income Statement / Balance Sheet / Cash Flow tabs above the snapshot table; set Timeframe to Annual. Click an image to enlarge.
Theoretical Foundation & Equation
The Residual Income Model (RIM) is grounded in clean-surplus accounting. If a firm generates a Return on Equity (ROE) exactly equal to its cost of equity (ke), its value equals its book value. Value is created only when ROE exceeds ke.
| Symbol | Variable Name | Description | Filing Source Guide |
|---|---|---|---|
| B_0 | Book Value (BVPS) | Total common stockholders equity or Book Value Per Share | SEC EDGAR > 10-K Balance Sheet > Total Stockholders' Equity |
| ROE | Expected Return on Equity | Sustainable annual Net Income divided by Book Equity | Historical 3-5 year weighted average ROE or consensus estimates |
| k_e | Cost of Equity | Minimum required rate of return for equity holders | CAPM (Risk-free rate + Beta × ERP) or Investment-grade Corporate Bond Yield (8-9%) |
| ω (omega) | Excess Return Persistence Factor | Persistence coefficient: 1.0 (sustainable moat), 0.9 (10% annual fade), 0.8 (20% fade) | Reflects competitive dynamics and economic moat erosion |
Step-by-Step Worked Example
A stable manufacturing company with $500M total common equity, 50 million shares outstanding ($10.00 book value per share), 15.0% expected ROE, and 8.0% cost of equity.
The firm generates a 700 bps return above its cost of capital.
Annual economic excess earnings per share.
At a current trading price of $13.00, the stock sits at the conservative 20% fade threshold and offers a ~31% margin of safety against the base sustained fair value of $18.75.
Suitability Checklist & Limitations
- •Firms with reliable book values and stable positive ROE profiles (manufacturing, consumer staples, financials)
- •Investors seeking an intrinsic model without sensitive terminal cash flow assumptions
- •Mature value companies with clear accounting history
- •Unprofitable or distressed companies with negative book equity
- •Firms with frequent dilutive secondary offerings or substantial restructurings
- •Asset-light early-stage tech where tangible book value is negligible
For high-growth asset-light companies, a multi-stage DCF forecasting cash generation is superior.
Frequently Asked Questions
Earnings, Book Values, and Dividends in Equity Valuation (Contemporary Accounting Research, 1995)
View Source / Filing Reference- One-off non-operating gains (asset sales) must be normalized out of expected ROE.
- This calculator is for educational estimation and does not constitute investment advice.