2-Stage DCF (Discounted Cash Flow) Calculator
DCF values a company by projecting Free Cash Flow to Firm (FCFF), discounting it by the Weighted Average Cost of Capital (WACC), and adjusting for net debt to determine fair equity value per share.
Find inputs with free data (Finviz)
Find the values below on the Finviz quote page and enter them in the calculator.
| Calculator input | Where on Finviz |
|---|---|
| Base FCFF | Cash Flow > Free Cash Flow |
| Stage 1 growth | Snapshot > EPS next 5Y, adjusted conservatively |
| Net debt | (ST Debt + LT Debt) − Cash & ST Investments |
| Shares outstanding | Income Statement > Shares Outstanding |
| WACC · terminal growth · duration | Your assumptions |
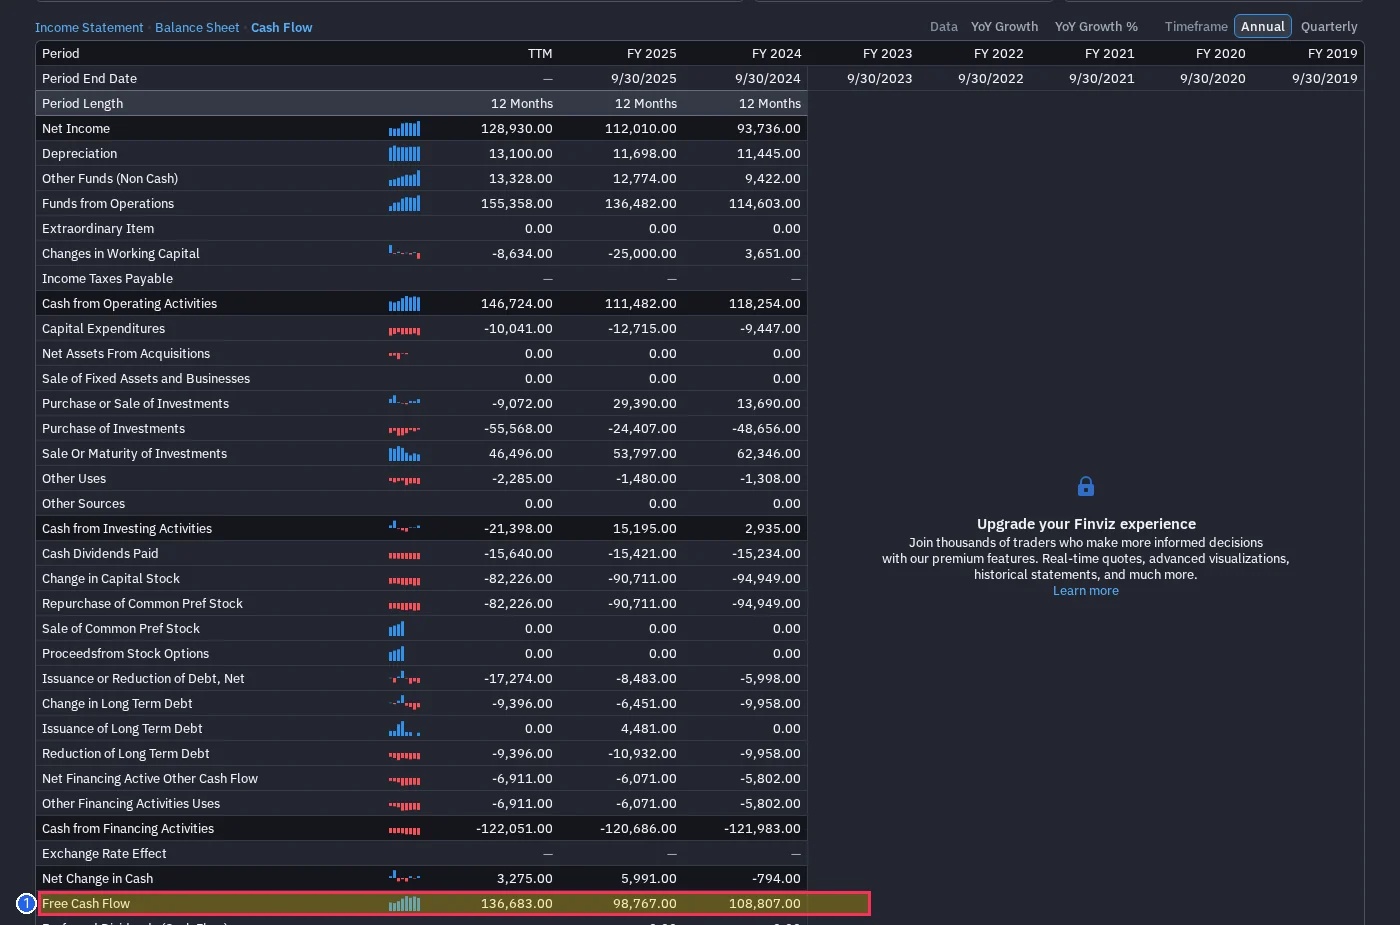
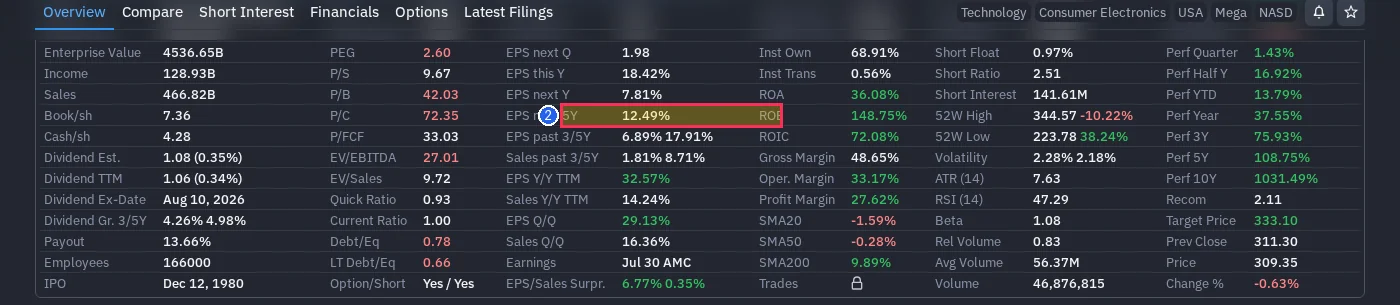
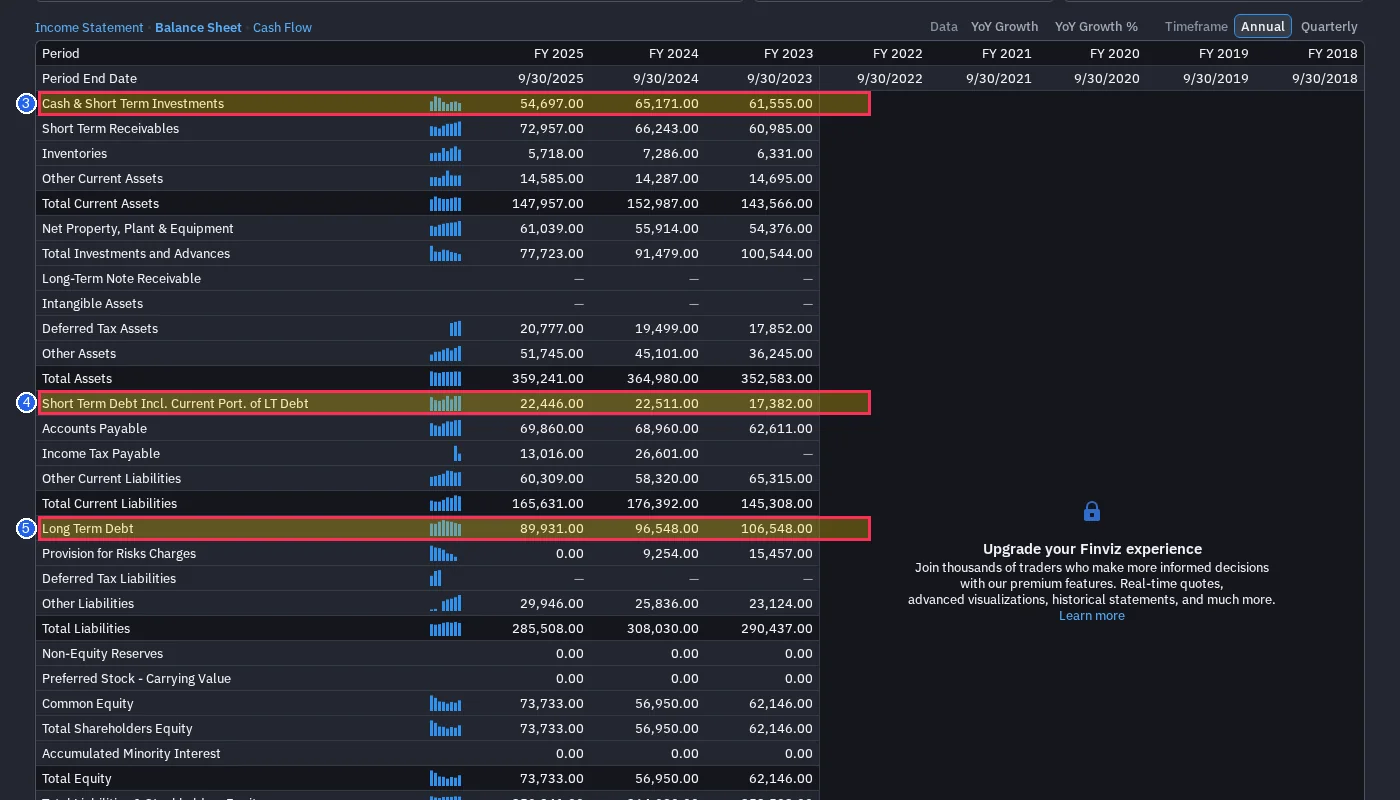
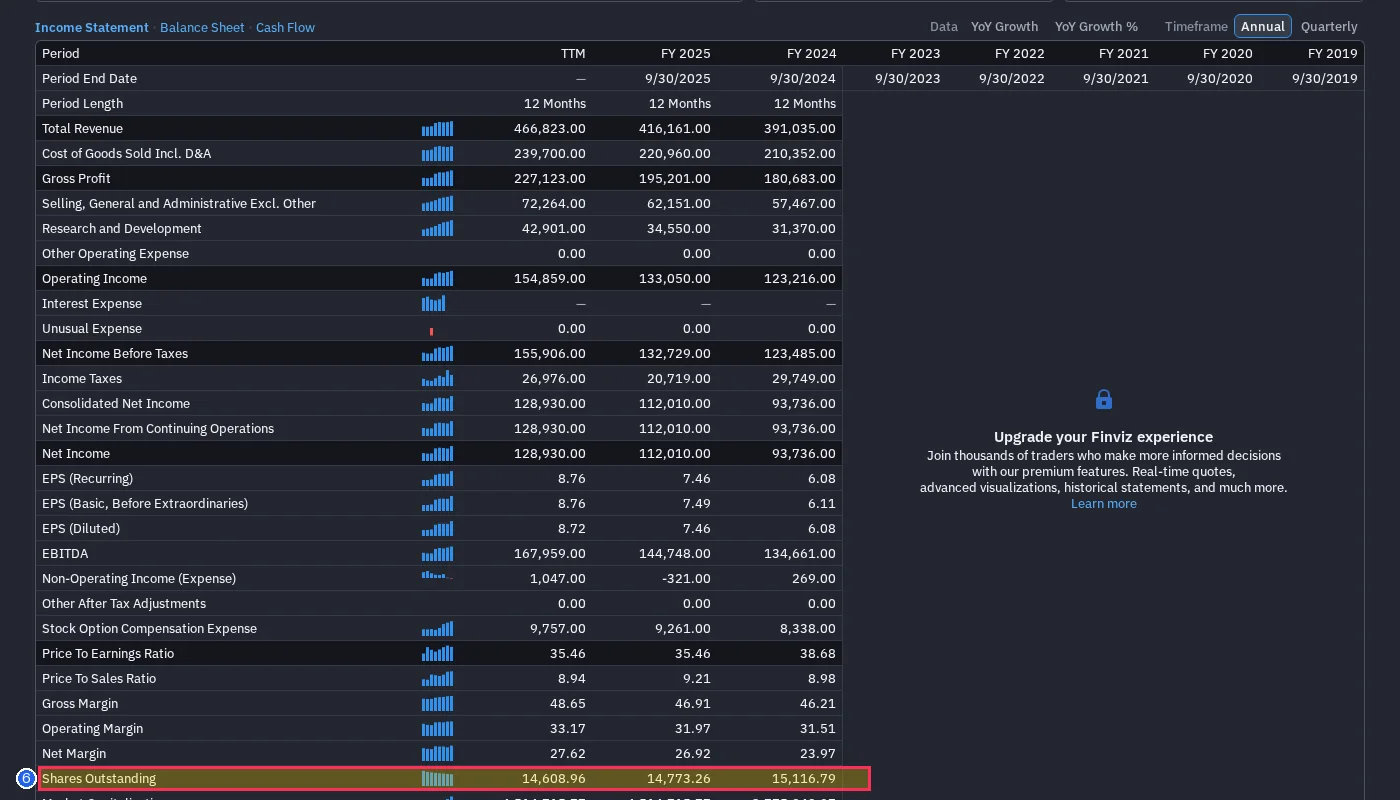
Financial statement figures are under the Income Statement / Balance Sheet / Cash Flow tabs above the snapshot table; set Timeframe to Annual. Click an image to enlarge.
Theoretical Foundation & Equation
A 2-stage FCFF DCF model splits enterprise valuation into an explicit high-growth forecast period (years 1 to n) and a perpetual stable growth Terminal Value period discounted back to present value.
| Symbol | Variable Name | Description | Filing Source Guide |
|---|---|---|---|
| FCFF_t | Free Cash Flow to Firm | Operating Cash Flow minus Capital Expenditures (CapEx) and working capital changes | Cash Flow Statement: CFO minus CapEx |
| WACC | Weighted Average Cost of Capital | Blended cost of equity and after-tax cost of debt weighted by target capital structure | Calculated via CAPM + credit spread, typically 7-10% |
| g_T | Perpetual Growth Rate | Long-term sustainable growth rate capped at the long-term GDP growth rate (1.5-2.5%) | Conservative economic growth expectations |
| Net Debt | Net Debt | Total interest-bearing debt minus excess cash & marketable securities | Balance Sheet: Total Debt - Cash & Cash Equivalents |
Step-by-Step Worked Example
FCFF projected at $10M, $11M, $12M for years 1-3, terminal growth 3.0%, WACC 9.0%, Net Debt $30M, 10M diluted shares.
Enterprise value of $186.77M less $30M net debt leaves $156.77M equity value, yielding a fair value of $15.68 per share.
Suitability Checklist & Limitations
- •Non-financial corporations with predictable operating cash flows and rational CapEx
- •Mature industrial, healthcare, tech infrastructure, and consumer companies
- •Acquisition and buyout analysis where full enterprise cash flow is evaluated
- •Commercial banks, insurance companies, and financial institutions (debt is an operational asset)
- •Early-stage pre-revenue startups with deeply negative cash flows and no visibility
For financial institutions, the Dividend Discount Model (DDM) or S-RIM is standard practice.
Frequently Asked Questions
Investment Valuation: Tools and Techniques for Determining the Value of Any Asset (3rd Ed.)
View Source / Filing Reference- DCF is highly sensitive to terminal growth and WACC parameters; always check the 3-tier sensitivity bands.
- For educational reference only; not investment advice.